Analyze and Improve Delivery Performance With Analytics
With track123 Analytics, you can monitor the performance of your shipments, filter carriers to understand how well different carriers are doing.
In this tutorial, we’ll show you:
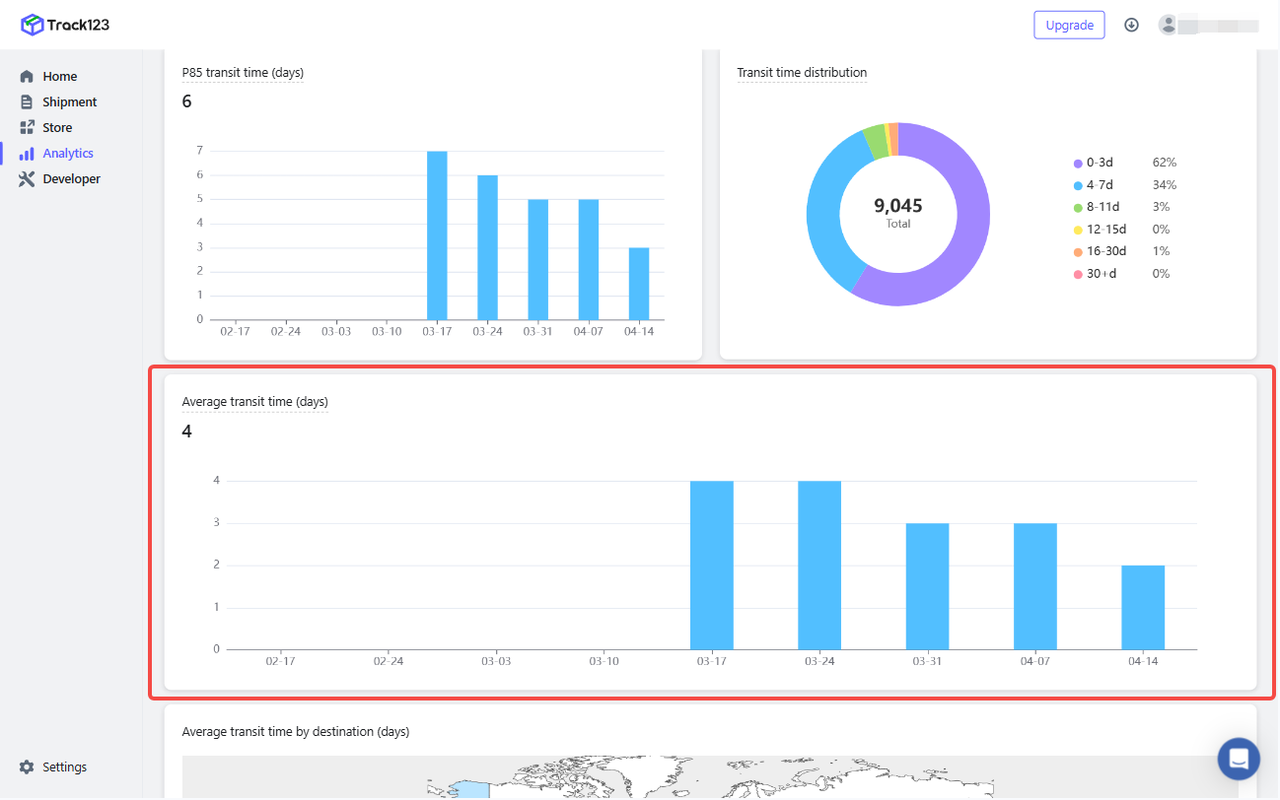
- Definition: It shows the average time shipments took to reach their destination.
-
Use case: To measure the overall efficiency of your shipping operations.
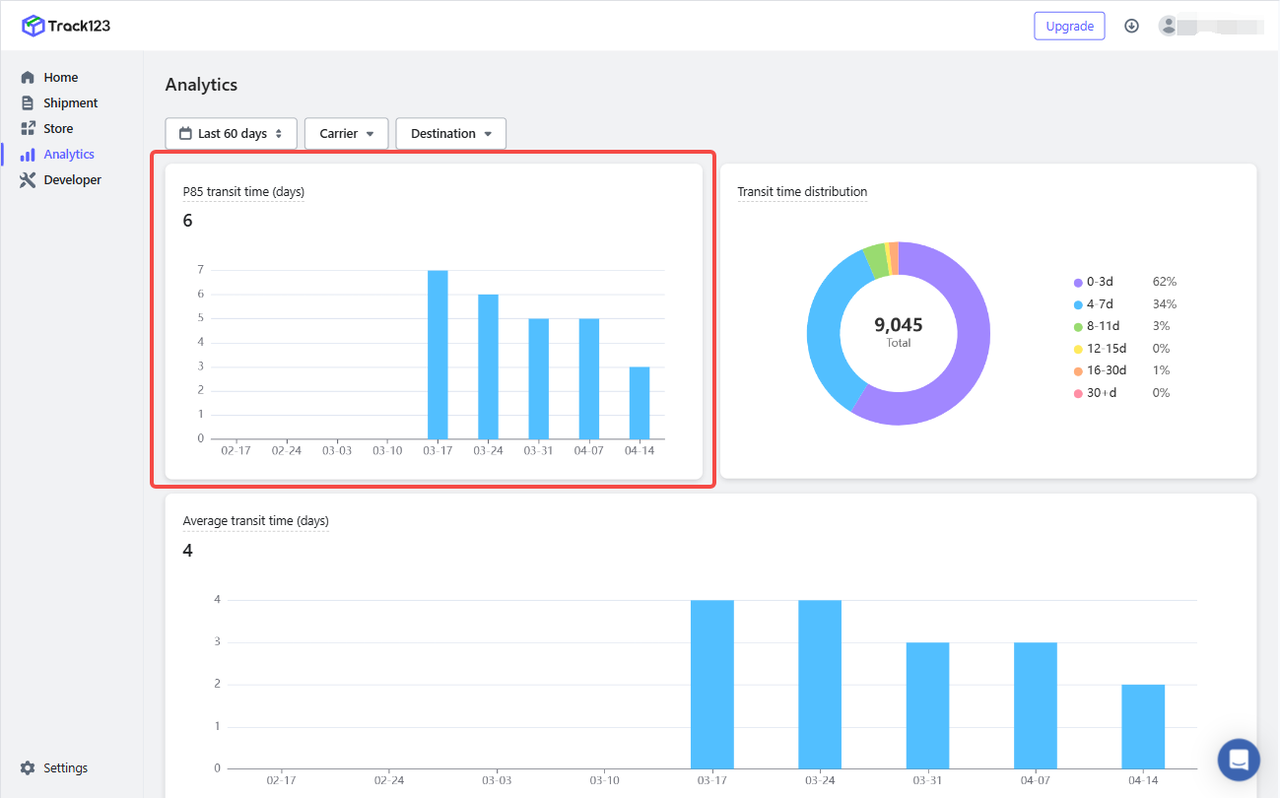
 P85 transit time (days)
 - Definition: It shows 85th percentile transit time which means 85% of shipments had a transit time equal to or faster than this.
-
Use case: If your P85 time is too high, it means some shipments are arriving significantly later than the average. In this case, you can filter by carrier to find out outlier carriers.
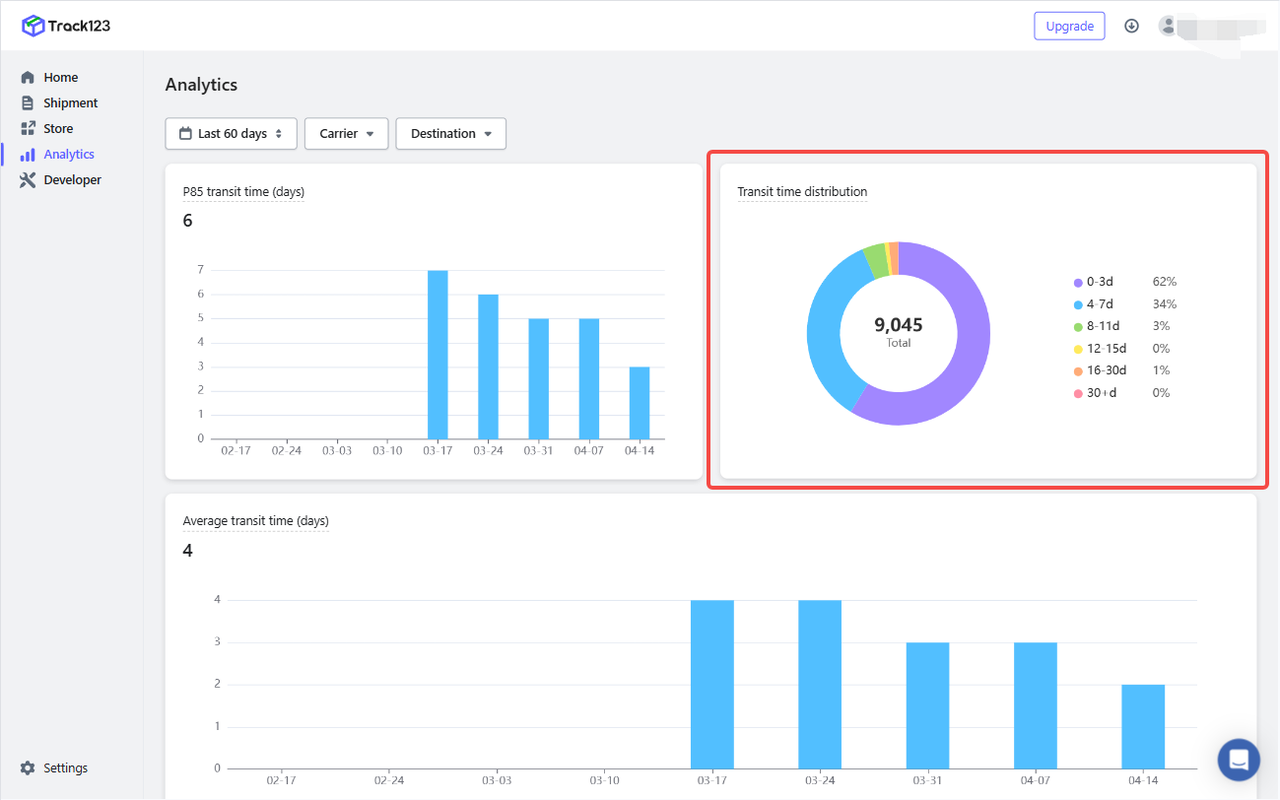
 Transit time distribution
 - Definition: It shows the transit time based on the number of days.
-
Use case: To identify how many packages are delayed beyond acceptable limits.
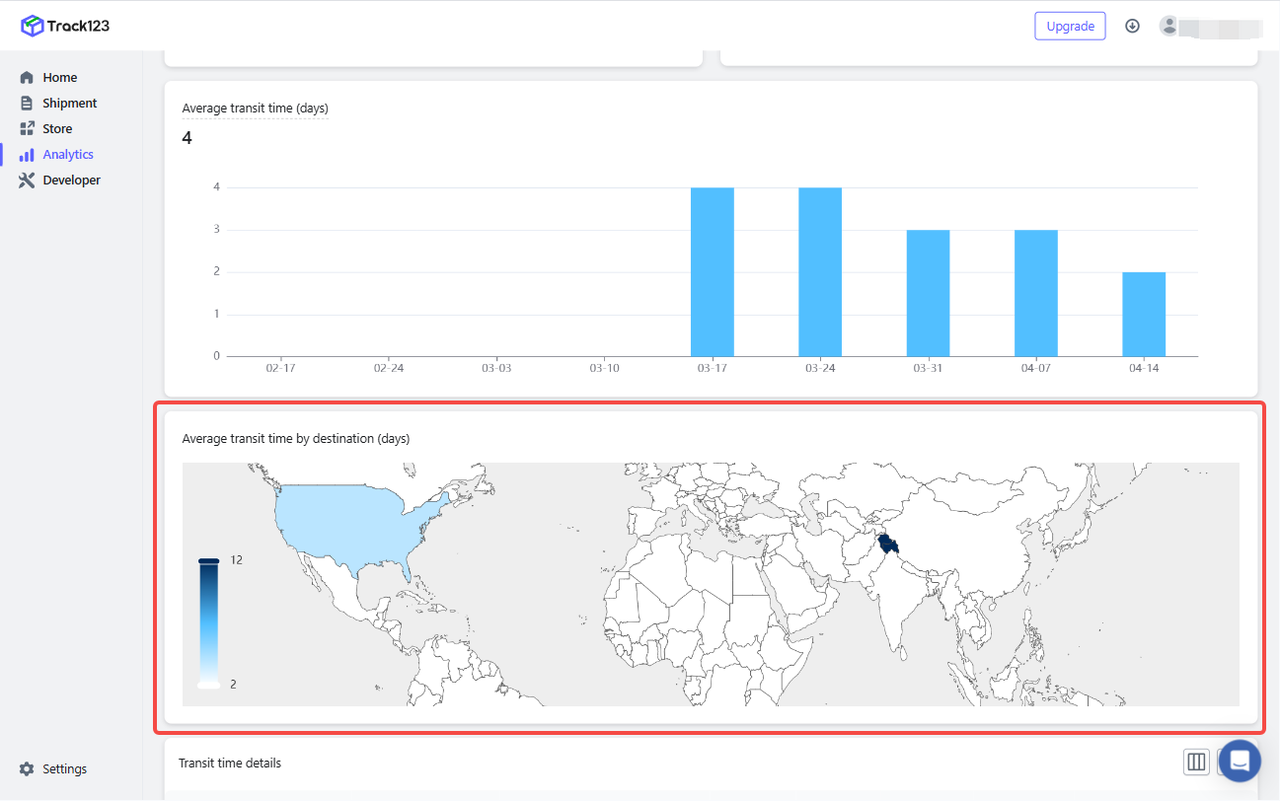
 Average transit time by destination
 - Definition: It shows the average transit time for your shipments across diverse locations.
-
Use case: Easily detect regions where delivery performance is slower or inconsistent,which will be useful for international logistics strategy.
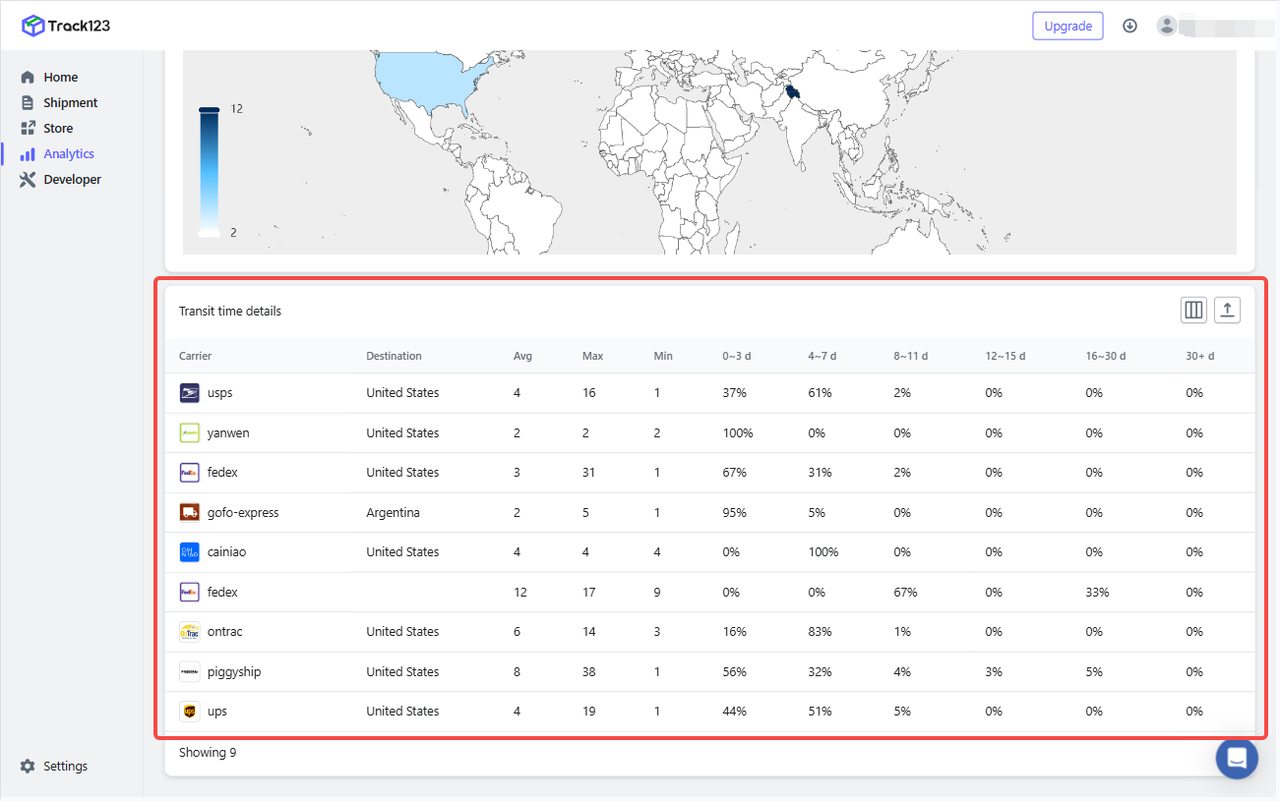
 Transit time by carrier and destination
 - Definition: It tells you how much transit time varies when you have different carriers for shipment delivery.
-
Use case: Compare performance across different carriers with the same destination,which will be useful for carrier selection by region.


How can you effectively use analytics module?
- Improve delivery performance by identifying slow routes or underperforming carriers.
- Optimize costs by choosing the most efficient carriers or regions to ship from.